To learn more about any of the EDA Services below, please fill out the support request form to create a support case. Please describe the request in detail.
Data Curation
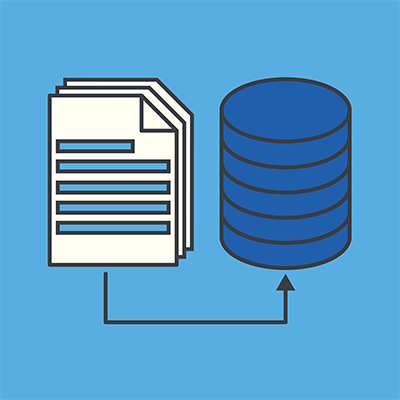 On premise and cloud data is available in real time or refreshed daily. Raw data is available to analytics tools for analysis and mining.
Data Architecture
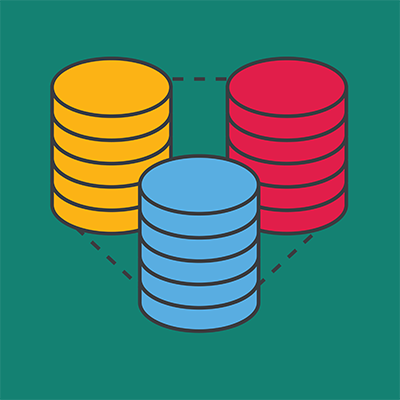 Raw data frequently used for analysis is cleansed, transformed, and optimized via dimensional modeling for analytics use. It is then integrated with tools such as Oracle Analytics Cloud (OAC) and Tableau for governed access.
Dashboard and Report Development
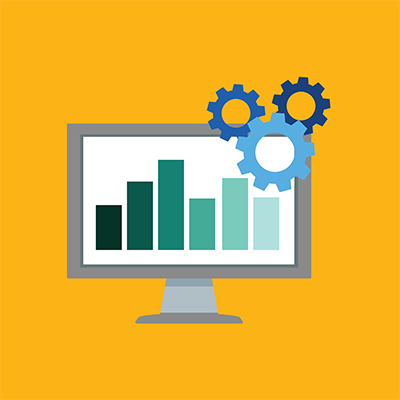
 In collaboration with end users and using agile methodology, we develop OAC and/or Tableau reports, visualizations, and interactive dashboards. Summit dashboards are used by thousands of users across the University system.
Self-Service Support
 We strive to enable more individuals to become self-sufficient in developing their own data products, including reports, dashboards, visualizations, machine learning and AI products.
Consulting
 Experts from the EDA team design data solutions spanning from business process development to infrastructure planning, dashboard development, and more.
Training
 Formal training is offered on the two primary development tools (OAC and Tableau). Summit Labs offer informal training where users can get assistance with data, models, reports or dashboards.
Cultivating a Community of Data Practitioners
 The EDA team collaborates with vendors and volunteers across UMass to host educational and collaborative webinars and events for data practitioners to work and learn together.
Data Science Development
 In cooperation with users and through select vendors we develop Machine Learning and Artificial Intelligence solutions.